
How to use Value Driver Trees (VDTs) to structure your BI program
While ensuring you don't accidentally miss important drivers of value for your business, as well as using the trees as a workshop prompt to generate interest and commitment from your stakeholders

Value Driver Trees (VDTs) are an extremely robust tool you need to have mastered as a BI practitioner. They are logical, clear, and can appeal strongly to your engineering and other (innate) sense-making instincts. And they help make sure you’re not missing important areas (‘value drivers’) as you frame up your BI portfolio for the year (or whichever other planing period you’re operating under).
Now, the problem with VDTs is that people often don’t really know how to construct a ‘good’ value driver tree. That is because there are numerous ways how you can get your VDT wrong and less useful than it could otherwise be. And not so many ways for how to get it just insightful, actionable and (importantly) concise enough to be powerful, and avoid turning into an overly academic exercise with limited practical applicability.
Let’s consider an example
For the sake of simplicity, assume you’re running a BI program for a restaurant chain, which already has 50 active units across the country, and is looking to grow the network further over the next 3-5 years (domestically and internationally). Where do you start? And how do you make the VDT practical to guide the design of your BI program?
Firstly, you need to think about the governing metric your BI program will chase. Broadly speaking, there are a few different ones you could potentially pick from:
Cost: How do we lower unit costs in order to increase profitability of each unit that we already operate?
EBITDA: How do we balance revenue and expenses (simultaneously) in order to maximise operating profits from our existing network of units? Key word here is ‘balance,’ as you often need to increase costs to drive up revenue (and EBITDA) in return.
Enterprise value: How do we couple profitability (i.e. EBITDA) with what investors might value the company at (i.e. enterprise value), so as to maximise how much the company is worth overall?
Equity value: Let’s also throw in the difference between debt-holders’ and equity-holders’ claims on the value of the company, and zero in on how to maximise (specifically) the equity value of the company (for our shareholders).
As you can see, each of these metics is a legitimate (potential) governing metric in its own right. Depending on the breadth of your mandate as Head of BI, you might end up picking a particular metric over all others. Or, if you’re especially driven and your working environment lends itself to this, you might also go ‘upstairs’ and present a vision for which governing metric you think your BI program should target (regardless of your current mandate).
Let’s assume you pick a broader governing metric
In our example above, it would be equity value. In many ways, that’s probably the best way to approach your BI program in the absence of political constraints on your mandate, because it makes sure you’re not going to ‘lose forest for the trees,’ or over-optimise certain parts of the business to the detriment of its broader performance. Like, for example, cutting down too heavily on costs, which then starts to affect revenue, EBITDA, and ultimately, the value of the business overall (but might do so with a delay).
What your (potential) VDT could look like is something like this:
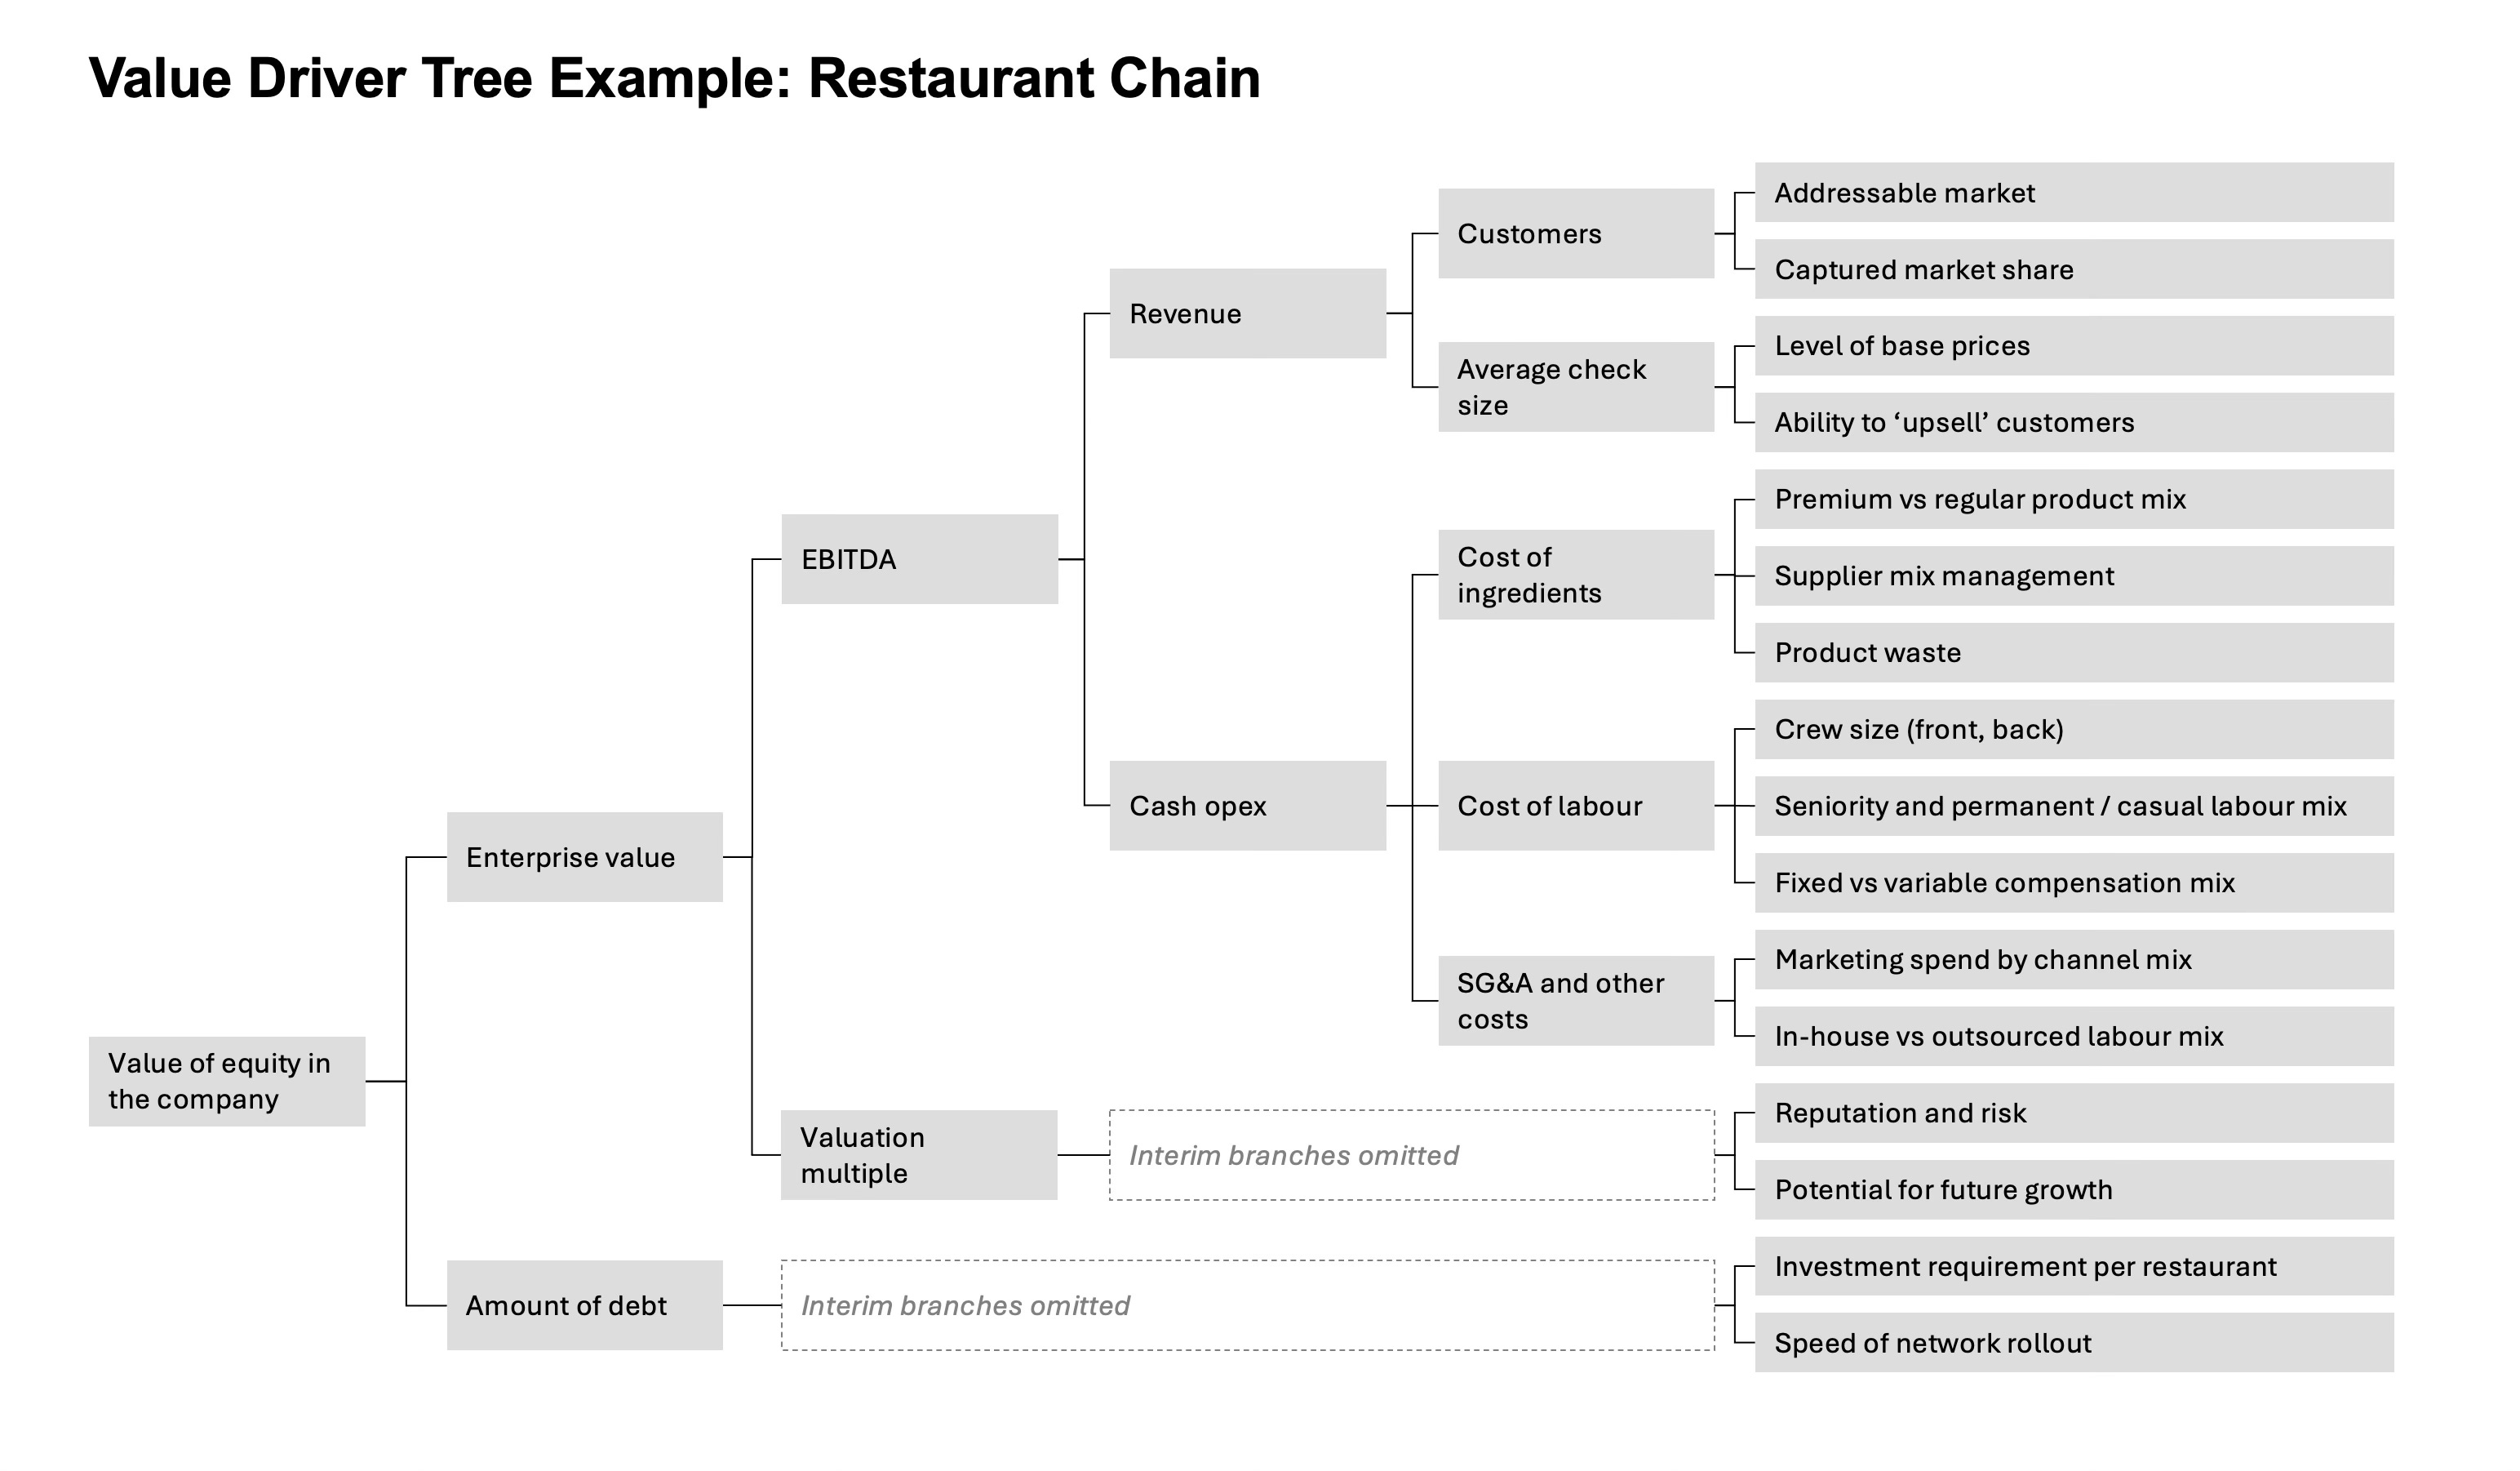
Here’s what you can notice when looking at this sample value driver tree:
Comprehensiveness: The tree aims to have branches (and individual drivers) that cover the most important items, which influence your governing metric. This includes deconstructing the drivers for revenue, costs, valuation multiple, and level of external debt.
Conciseness: This tree could easily be blown out to look 10 times its current size (and complexity), as there is a lot of (minute) detail that can be added across its various branches and sub-branches. It would make the tree more precise, true, but also a lot harder to digest.
Practicality: You should always ask yourself if you’re making your VDT as practical and actionable as possible (as opposed to being sound theoretically, but with branches that don’t really lend themselves to subsequent ideation). You might need to make certain compromises here in order to reach this objective (e.g., accepting not being 100% precise or comprehensive in certain areas). But it’s well worth optimising for practicality in most cases (unless you’re writing an academic paper).
It’s also worth noting that there is no single (‘strictly right’) way of constructing a VDT for a business like this (or any business, for that matter), as you can choose to prioritise certain branches more than others, or frame certain parts of the tree differently depending on your circumstances (and preferences). But if you aim to stay close to these three principles above, you’ll most likely end up with something useful (and powerful).
Let’s now use this VDT to brainstorm some improvement projects
It’s important to recognise that building a VDT is only the first step in your BI planning effort, as the VDT is not an end goal in and of itself. Rather, the value of a VDT (really) lies in helping you to better brainstorm and identify improvement opportunities. And because of the relatively tight logic needed to link various branches of the VDT together, it helps reduce the probability you’ll miss an important source of value for your company somewhere along the way.
In our example, what you do next after you’ve developed your VDT, is ask yourself: ‘What are the different improvement projects we (as a business) could pursue to improve the state of each (critical) driver of value in our company.’ And this is where the magic of the VDT will come into play. By its very nature, the VDT will force you to think through areas of the business that you might otherwise ignore (or forget to think about). And this gives structure and robustness to your overall BI brainstorm.
Have a look at what potential results of this activity could look like (using the right-hand side of the VDT from the previous snapshot as foundation):
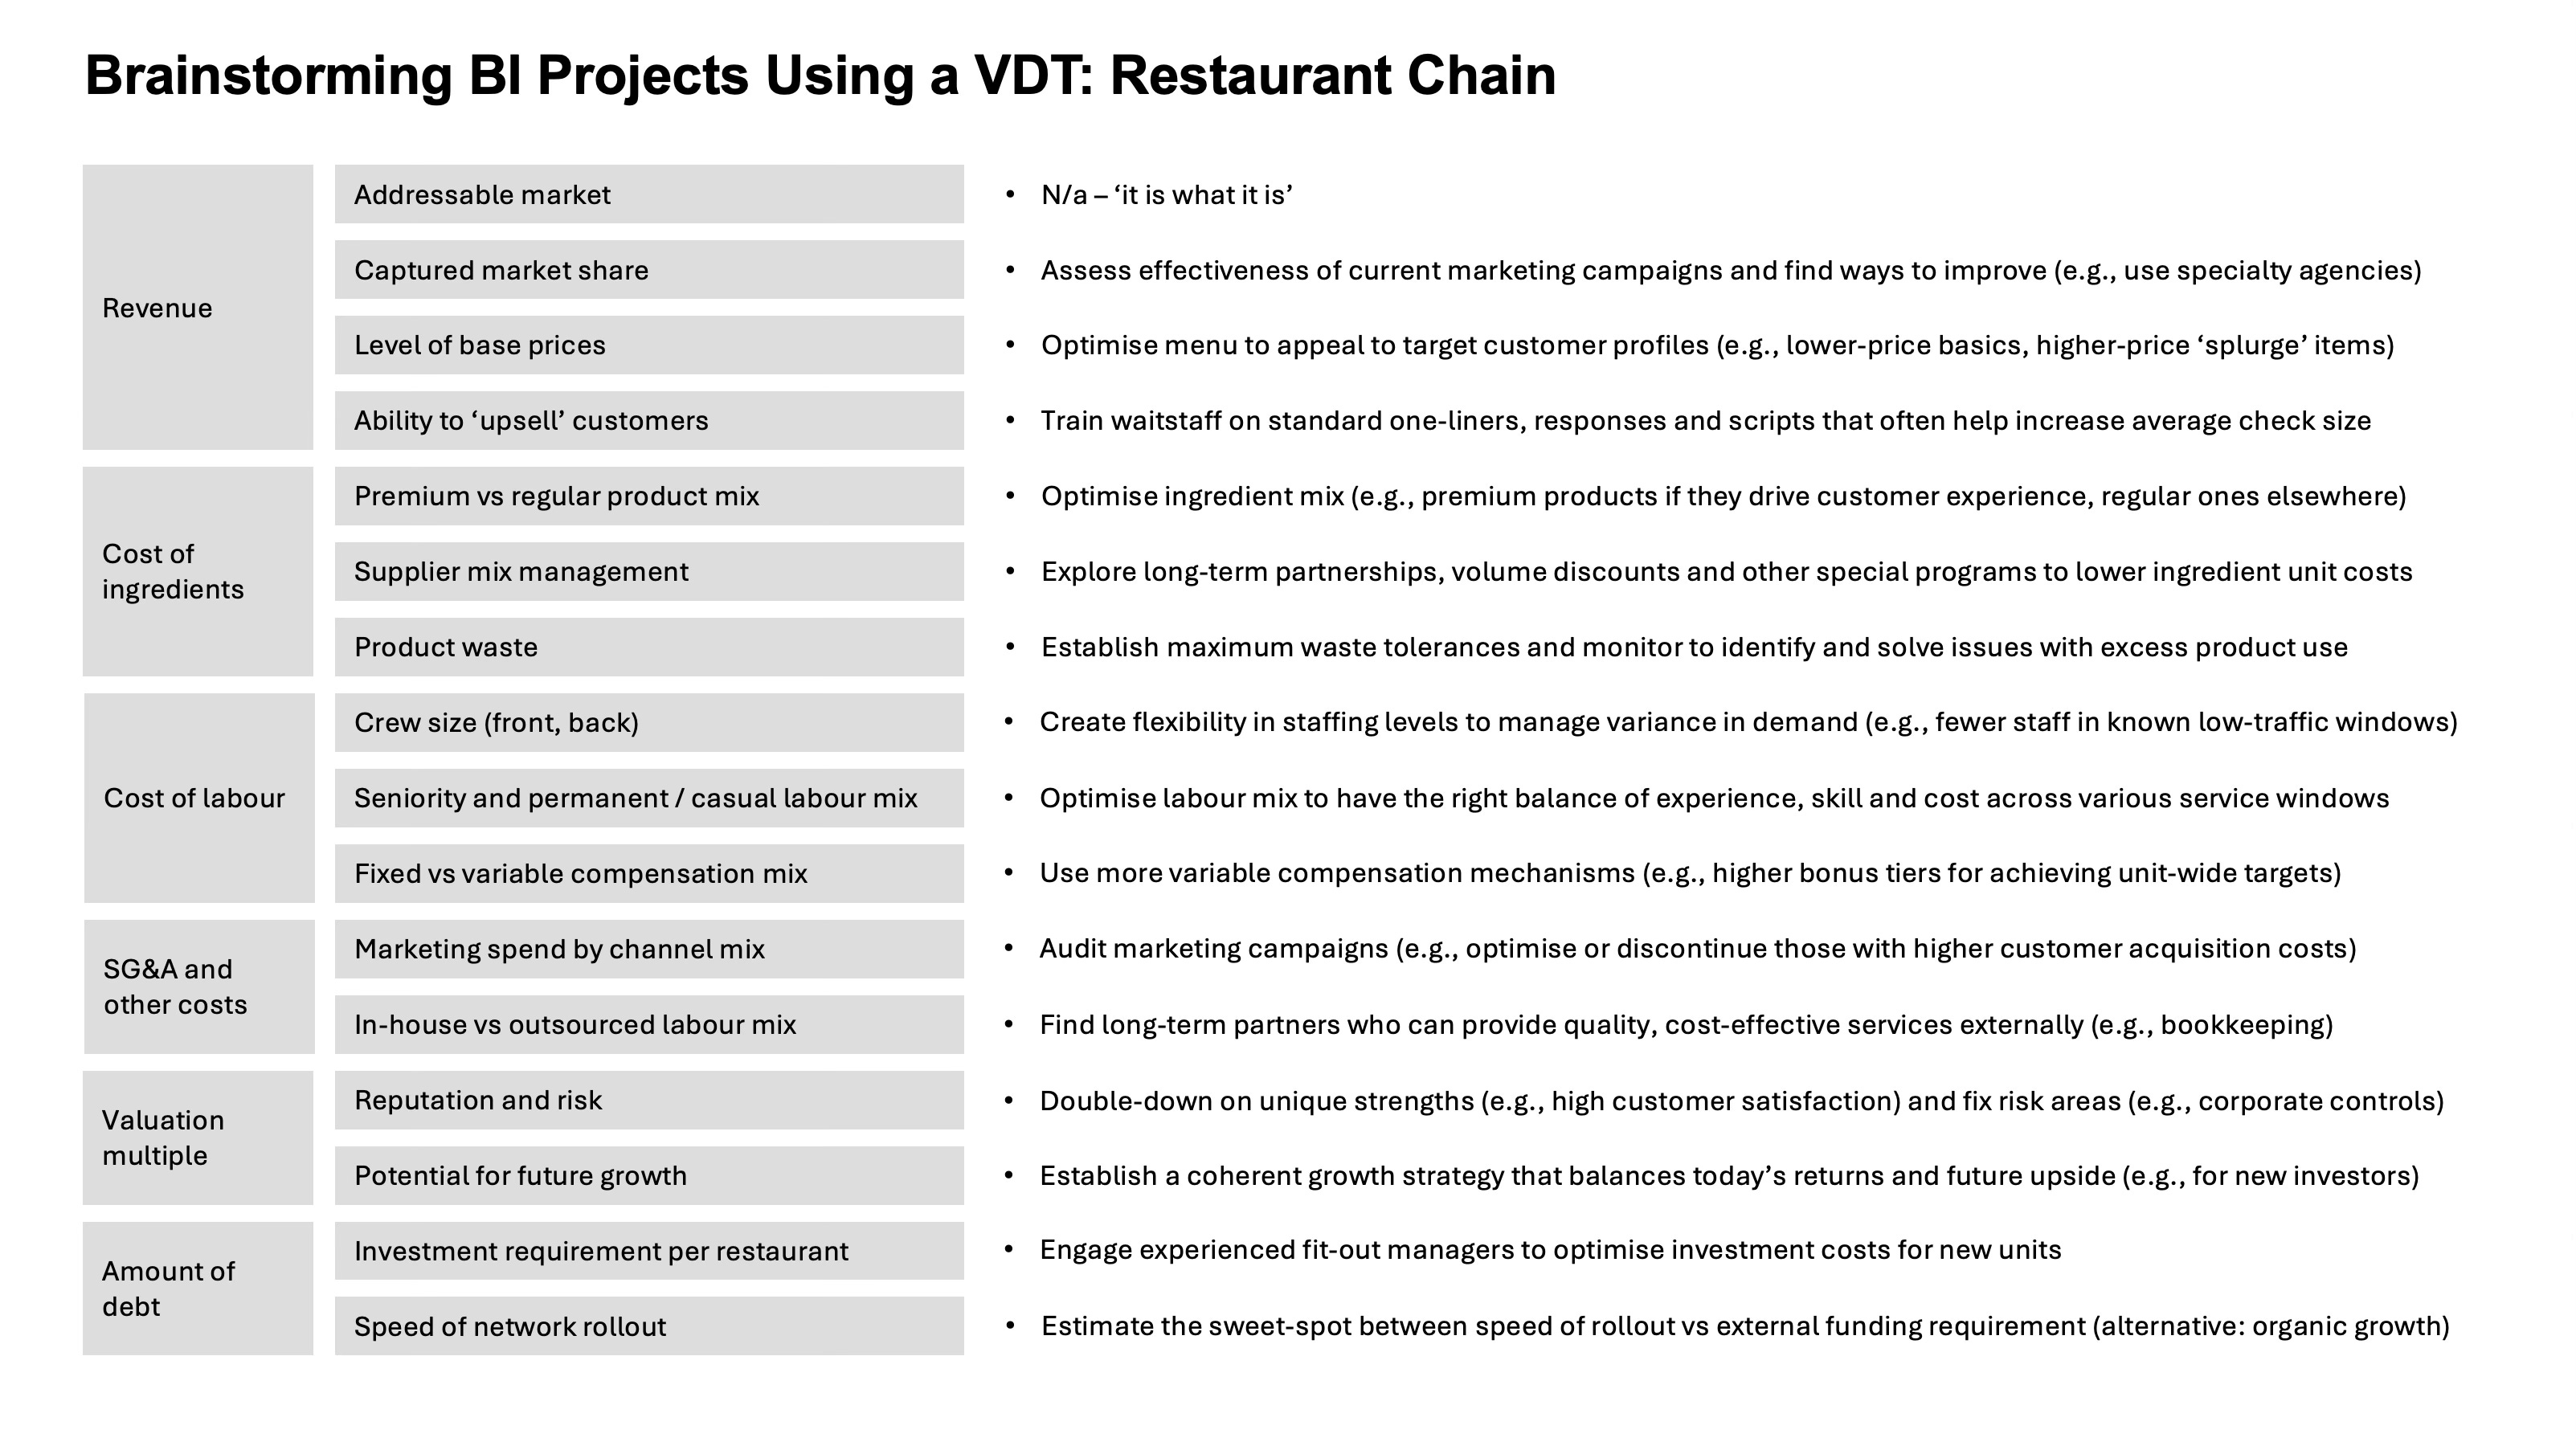
As you can see, with some of the branches, you just can’t really do anything about them, particularly in the short term (e.g., being able to increase the size of your addressable market). However, all of the other areas seem quite capable of being improved. Your job then is to figure out what those improvement activities could look like, whether by yourself (based on your individual experience) or with stakeholders from across the business.
Speaking of which, doing this exercise as a workshop is a particularly worthwhile activity. Reasons are that (i) not only do you get the benefit of having more eyes (and brains) looking at the overall problem you’re trying to solve, but also (ii) that your stakeholders will have more buy-in with the resulting list of improvement projects simply by being a part of the exercise. It is always harder to subsequently criticise ideas that you (yourself) helped produce in the first place.
What to do after you’ve populated your BI portfolio
Once you’ve got the list of improvement projects generated, you become broadly ready to start implementing them. This is where the rest of your BI schooling and templates comes in, whether it’s assigning project owners, agreeing on deadlines, estimating resource requirements, evaluating investment needs, comparing benefits vs costs, and so on. All of the classic project management activities.
One elegant activity you can do at this stage is to estimate the size of the possible improvement in each driver, which your projects are aiming to pursue. For example, your labour-related activities might give you a 5% (net) cost saving across the board for the year. At the same time, your corporate controls program and an update to your growth strategy might help improve your (future) valuation multiple by 0.5 points (which you could estimate by benchmarking to competitors who are ahead of you on these parameters).
The trick is that once you’ve done your (upfront) estimates for each of your key drivers of value, you can then come up with what you think will (ultimately) happen to your overall governing metric. As you recall, in our example it was equity value. Let’s say you’ve estimated that this particular portfolio of BI activities can (mathematically) increase your equity value by $70 million, if everything is delivered as planned. That is an extremely useful little number, because it then allows you to compare the cost of this BI portfolio to the likely benefit all of your shareholders will receive.
The other thing this number lets you do is establish the right amount of focus (and urgency) when it comes to your BI portfolio. After all, there may not be too many other activities across the business that are aiming to generate this much value to the company within the same timeframe. This might help you generate a bit more buy-in than you would otherwise have, open some further (internal) doors, and loosen purse strings should you require some more investment to deliver all of the projects contemplated in your BI portfolio.
Conclusion
Hopefully, you can see that VDTs can be a highly useful and effective tool in your BI arsenal, particularly if you get good at utilising it. It will make your overall BI approach look much more robust (even ‘scientific,’ if that is of value), and help ensure you’re focussing on the right projects. And it will make you (as Head of BI) a much better thinker as well. Having mastered this skill, you’ll become able to quickly and effortlessly prioritise projects from across the business, and develop a strong intuition for what types of activities would deliver the most value to your organisation.
***
We hope that you enjoyed this post, and if so, would appreciate you leaving us a comment. If you also choose to share this article (or the overall website) with others in your professional network, that would be even more incredibly helpful.
We appreciate your time and looking forward to hearing from you if you have any thoughts or questions.
Cover image credits: Unsplash